m <-lm(math~1, data = skor)d <-coef(summary(m))knitr::kable(d)
Estimate
Std. Error
t value
Pr(>|t|)
(Intercept)
402.3658
2.963256
135.785
0
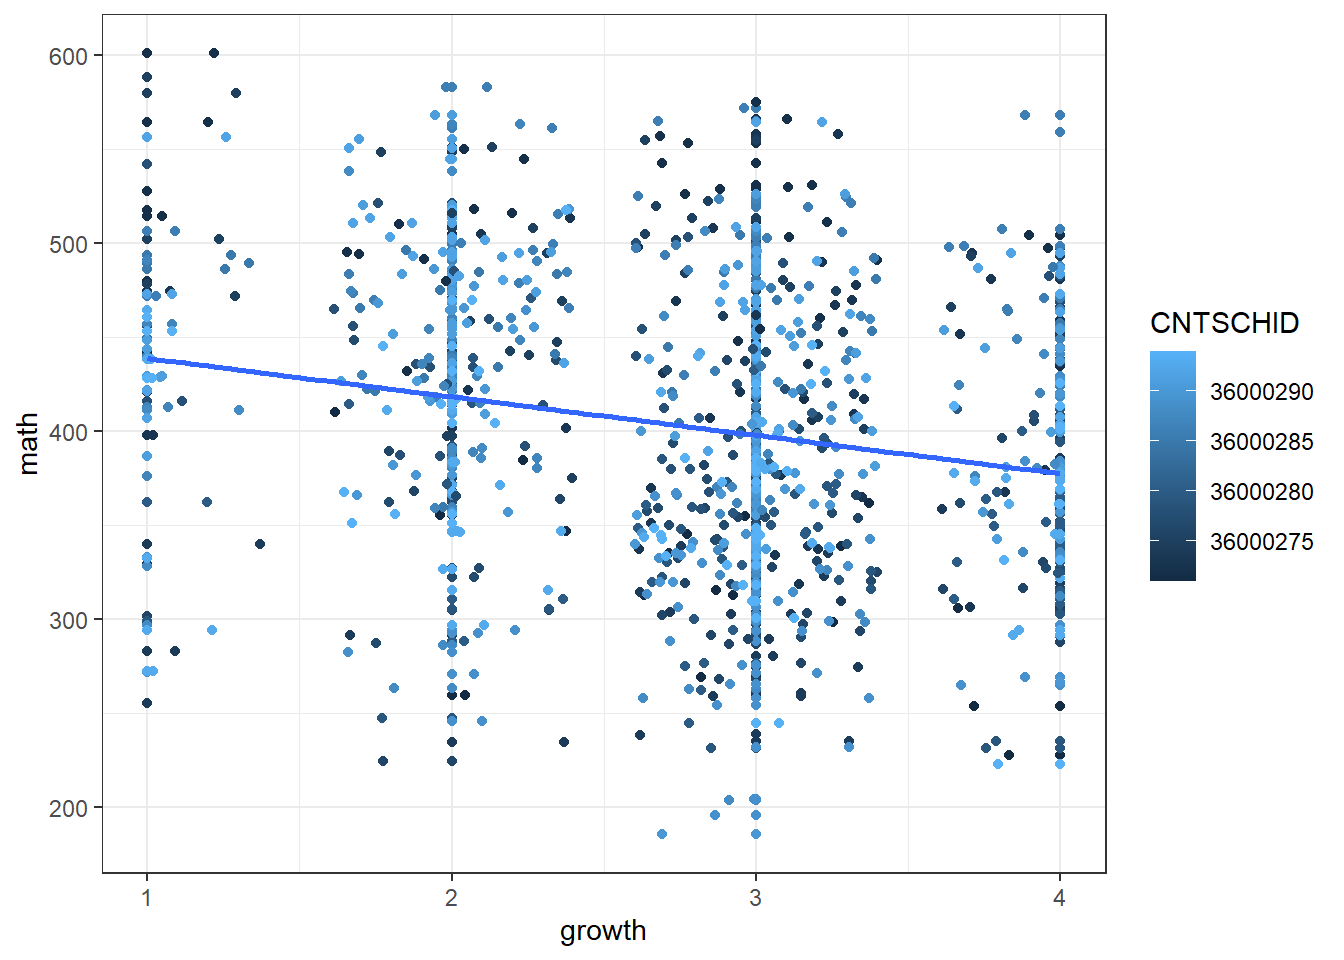
Garis regresi
p1 <-ggplot(data = skor, aes(x=growth, y = math, color = CNTSCHID))+xlim(1,4)+geom_point()+geom_jitter() +geom_smooth(method="lm", se =FALSE)+theme_bw()print(p1)
`geom_smooth()` using formula = 'y ~ x'
Warning: The following aesthetics were dropped during statistical transformation: colour
i This can happen when ggplot fails to infer the correct grouping structure in
  the data.
i Did you forget to specify a `group` aesthetic or to convert a numerical
  variable into a factor?